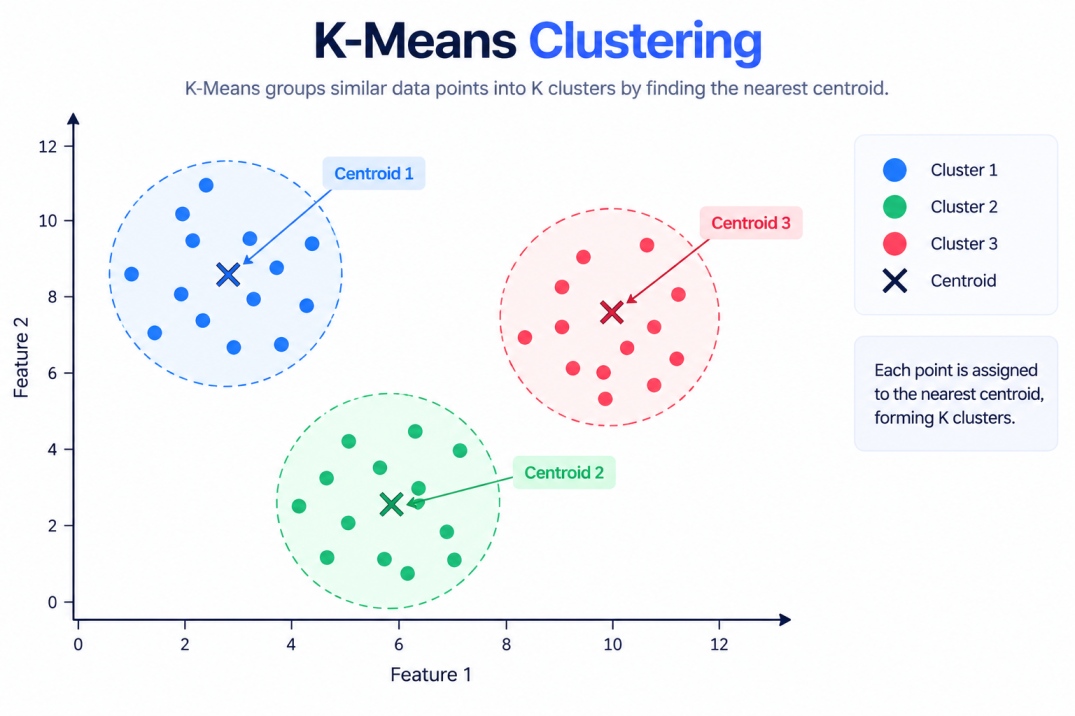
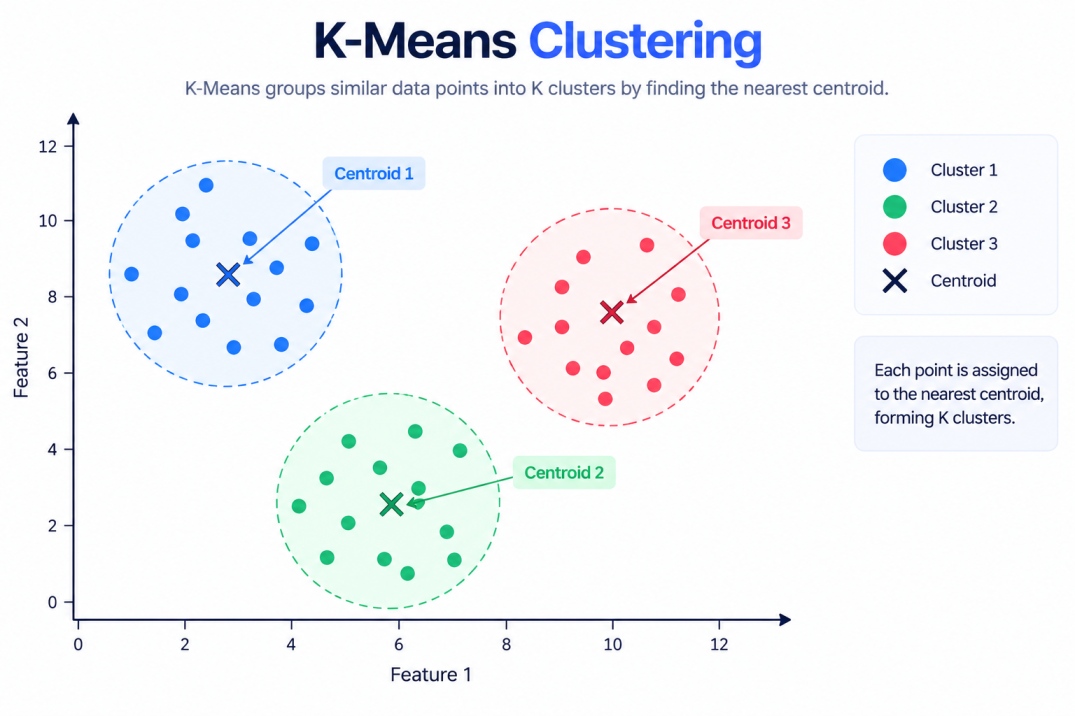
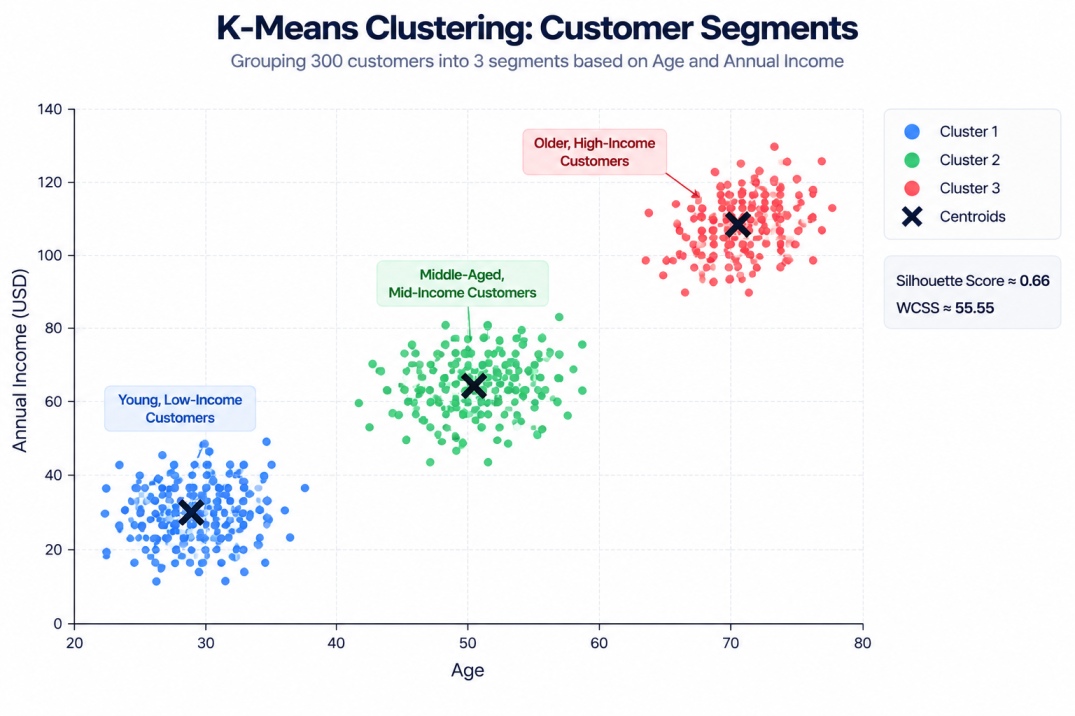
Now you understand how K-Means groups similar data points, let’s see how it is different from KNN, which is another popular machine learning algorithm.
K Means Clustering vs KNN
Although their names sound similar, K-Means and KNN are fundamentally different machine learning algorithms.
Feature | K-Means Clustering | KNN |
Learning type | Unsupervised | Supervised |
Main purpose | Group similar data points | Make predictions |
Uses labelled data? | No | Yes |
Meaning of K | Number of clusters | Number of neighbours |
Output | Cluster assignment | Class or numerical prediction |
Common use | Customer segmentation | Classification and regression |
K Means clustering algorithm discovers patterns in unlabelled data, while KNN uses labelled examples to predict the outcome for a new observation.
Also Read: Gradient Boosting Algorithm in Machine Learning: How It Works, and Practical Examples
Key Concepts in K-Means Clustering
To understand the k means clustering algorithm, it is important to know concepts such as K, centroids, distance, the objective function, WCSS, and convergence. So now let’s discuss all these key concepts.
1. What Is K in K-Means?
K in K means clustering is simply the number of clusters the algorithm is asked to create. Unlike many other parameters in machine learning, K has to be decided before the algorithm runs at all.
For example, if:
K = 3
The algorithm attempts to divide the dataset into three clusters.
2. What Is a Centroid?
A centroid is the central point of a cluster, and it acts as that cluster's representative location in the feature space. Every data point in the dataset is assigned to whichever centroid it is closest to, and the position of each centroid is what actually defines the shape and membership of its corresponding cluster.
How Are Centroids Calculated?
Suppose a cluster contains three points:
A = (2, 4)
B = (4, 6)
C = (6, 8)
The centroid is calculated by taking the average of each coordinate:
Centroid = ((2 + 4 + 6) / 3, (4 + 6 + 8) / 3)
Centroid = (4, 6)
The k means clustering algorithm repeatedly updates these centroids as data points move between clusters.
Also Read: Random Forest Algorithm in Machine Learning: Working, Types, Pseudocode
3. How Does K-Means Calculate Distance?
K-Means commonly uses Euclidean distance to determine how close a data point is to each centroid.
For two points:
A = (x₁, x₂)
B = (y₁, y₂)
The Euclidean distance is: Distance = √[(x₁ − y₁)² + (x₂ − y₂)²]
4. What Is the Objective Function?
The objective function in K means clustering is the specific quantity the algorithm is trying to minimize as it runs. In practical terms, it is trying to minimize the total distance between every data point and the centroid of the cluster it belongs to, since a lower total distance means the clusters are tighter and more internally consistent.
This can be represented as:
J = Σᵢ Σⱼ ||xᵢ − μⱼ||²
where:
xᵢ represents a data point
μⱼ represents the centroid of its assigned cluster
J represents the total clustering error
5. What Is Within-Cluster Sum of Squares (WCSS)?
Within-cluster sum of squares, or WCSS, is the mathematical formula that quantifies how tightly grouped the points within each cluster are. Its formula is:
WCSS = Σᵢ Σₓ∈Cᵢ ||x − μᵢ||²
where Cᵢ represents a cluster and μᵢ represents its centroid.
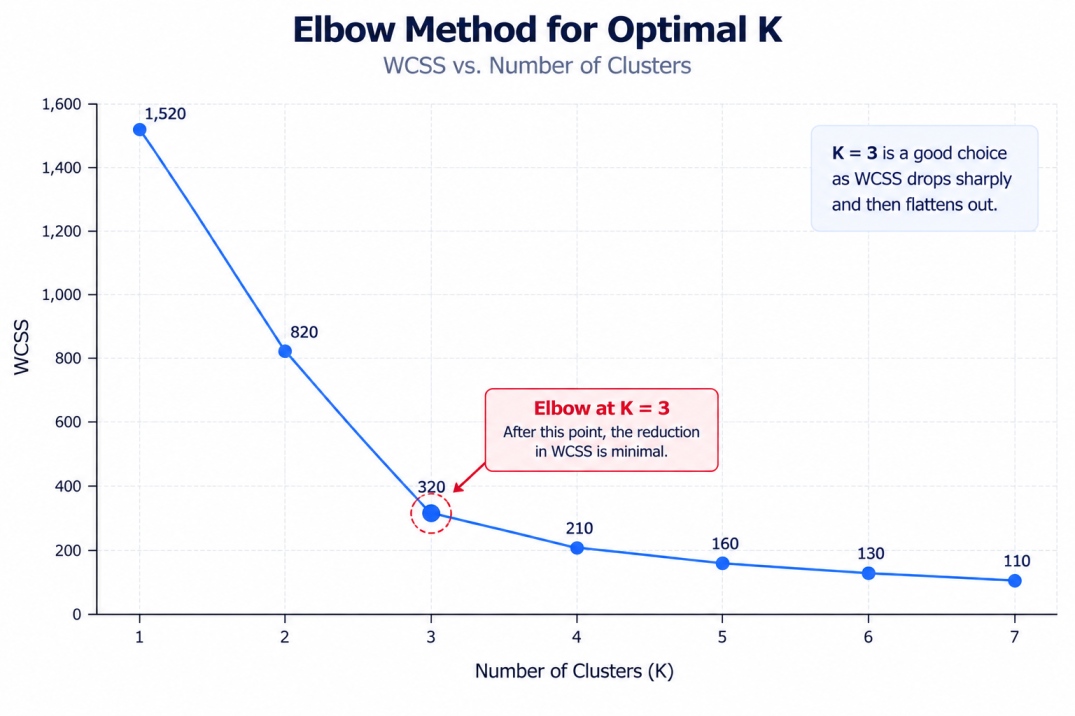
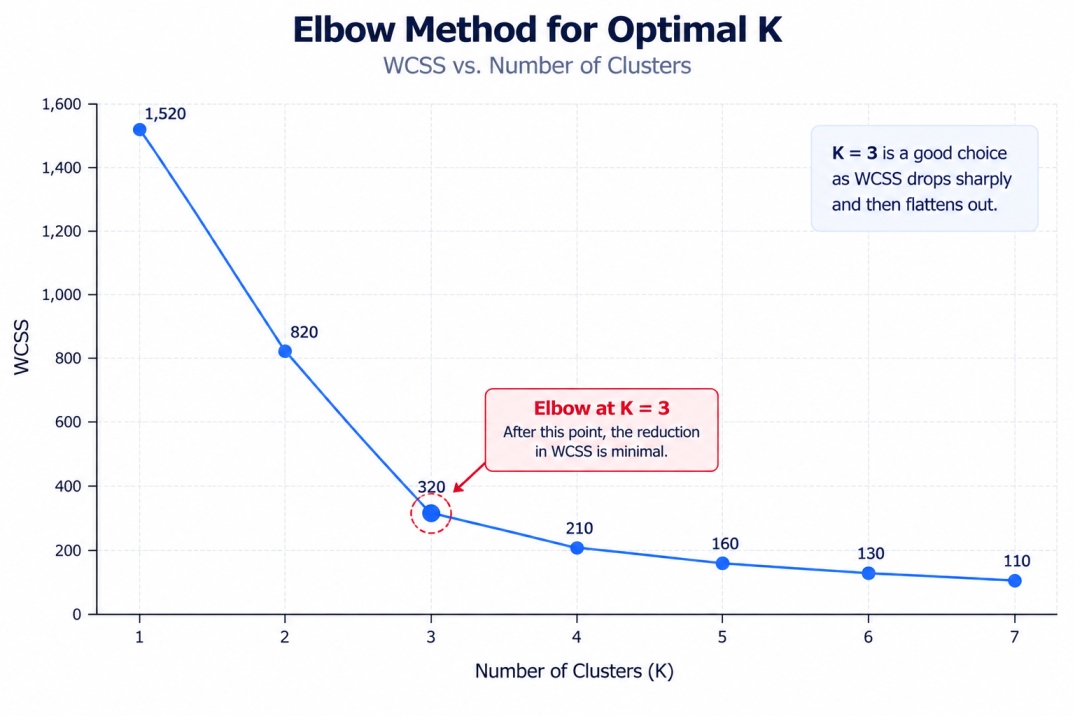
A lower WCSS means that points are, on average, closer to their assigned centroids. WCSS is also commonly used with the elbow method to help determine a suitable value of K.
6. What Does Convergence Mean in K-Means?
Convergence in K means clustering is the point at which the algorithm stops making meaningful changes between iterations, either because no data points switch cluster assignment anymore, or because the centroids stop moving by more than a very small threshold.
Once convergence is reached, the algorithm considers the clustering finished and returns the final cluster assignments and centroid positions.
Also Read: Decision Tree Algorithm in Machine Learning: How It Works, Types, and Examples
Now let’s understand the algorithm more with k means clustering pseudocode.
K Means Clustering Pseudocode
Understanding K means clustering pseudocode is a useful way to see the entire process of k means clustering in machine learning in the logical steps.
Given a dataset X and a chosen number of clusters K:
1. Initialize K centroids, typically using K-means++ or a random selection of K data points
2. Repeat until convergence:
a. Assignment step:
For each data point in X, calculate its distance to every centroid
Assign the data point to the cluster with the nearest centroid
b. Update step:
For each cluster, recalculate the centroid as the mean of all data points
currently assigned to that cluster
c. Check for convergence:
If cluster assignments did not change, or centroid movement is below
a small threshold, stop; otherwise repeat from the assignment step
3. Return the final cluster assignments and centroid positions
This pseudocode captures the two-step cycle, assigning points to the nearest centroid, then updating the centroids based on those assignments, that repeats over and over until the clustering stabilizes.
Also Read: Logistic Regression in Machine Learning: Algorithm, Types, Examples, and Applications
After exploring the K means clustering pseudocode and key concepts, now let’s understand how the K means clustering algorithm works.
How Does the K Means Clustering Algorithm Work?
The k means clustering algorithm works by repeatedly assigning data points to their nearest centroid and then recalculating the centroids based on those assignments.
The algorithm follow these key steps:
Step 1: Choose the Number of Clusters
First, select the value of K. For example:
K = 3
This means the algorithm will create three clusters.
Step 2: Initialise the Centroids
The algorithm then selects three initial centroids from the dataset or generates them using an appropriate initialisation strategy.
The initial positions can affect the final clusters, which is one reason methods such as K-Means++ are useful.
Step 3: Calculate the Distance
The algorithm calculates the distance between every data point and each centroid. For example, if a point is closer to Centroid 1 than Centroids 2 and 3, it is assigned to Cluster 1.
Step 4: Assign Data Points to Clusters
Each observation is assigned to the cluster with the nearest centroid. The result might initially look like:
Cluster 1 → Points A, B, C
Cluster 2 → Points D, E, F
Cluster 3 → Points G, H, I
Step 5: Recalculate the Centroids
After assigning the points, K-Means calculates a new centroid for each cluster by taking the mean of the observations belonging to that cluster.
New Centroid = Average of all points assigned to the cluster
Step 6: Repeat the Process
The algorithm again calculates distances using the new centroids and reassigns the observations if necessary.
The process continues:
Initial Centroids
Calculate Distance
Assign Clusters
Recalculate Centroids
Repeat
Step 7: Stop When the Algorithm Converges
K-Means stops when the cluster assignments or centroids no longer change significantly, or when the maximum number of iterations is reached.
The final result is a set of K clusters where observations within each group are relatively similar according to the selected features.
Also Read: Supervised vs Unsupervised Learning: Differences, Examples, and Applications
Understanding the K Means Clustering working, helps you to understand the algorithm more clearly. Now let’s explore how to implement k means clustering algorithm using Python.
How to Implement K Means Clustering in Python
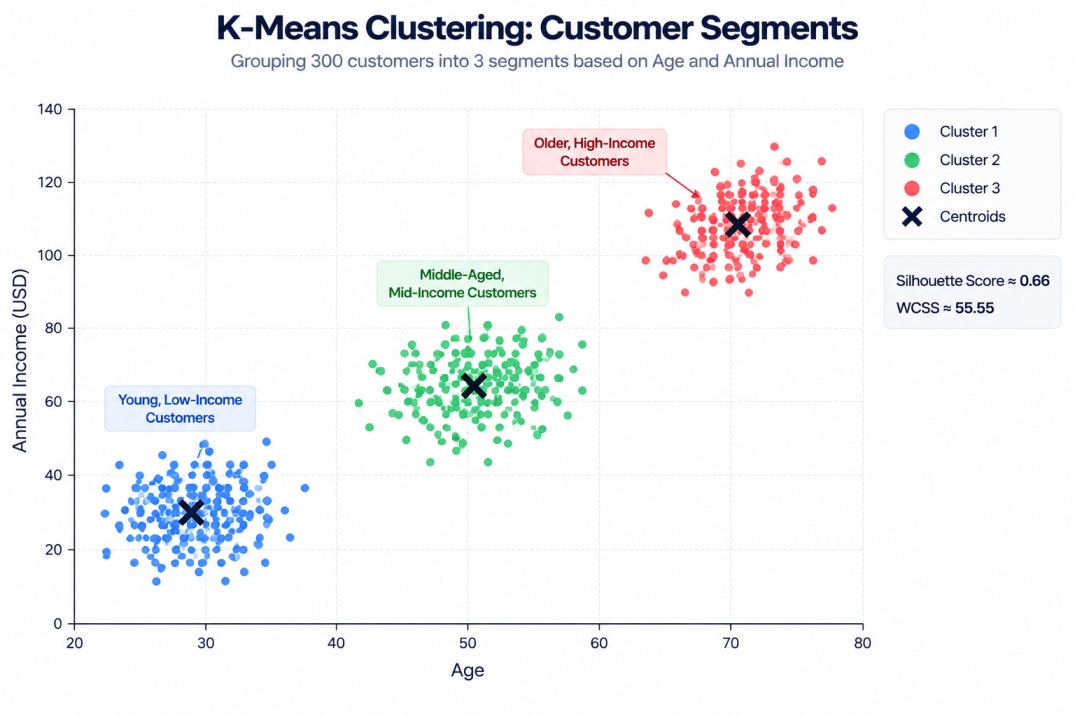
In this section you will get a complete K means clustering example in Python using scikit-learn, segmenting customers into groups based on age and annual income.
Import Required Libraries
import numpy as np
import pandas as pd
import matplotlib.pyplot as plt
from sklearn.preprocessing import StandardScaler
from sklearn.cluster import KMeans
from sklearn.metrics import silhouette_score
Load and Explore the Dataset
np.random.seed(42)
n = 300
cluster1 = np.random.normal(loc=[20, 30000], scale=[3, 5000], size=(n // 3, 2))
cluster2 = np.random.normal(loc=[35, 60000], scale=[4, 8000], size=(n // 3, 2))
cluster3 = np.random.normal(loc=[50, 90000], scale=[5, 10000], size=(n // 3, 2))
X = np.vstack([cluster1, cluster2, cluster3])
df = pd.DataFrame(X, columns=["Age", "AnnualIncome"])
print(df.head())
print(df.describe())
This creates a sample dataset of 300 customers across three natural age and income groupings, a common setup for a k means clustering example in customer segmentation.
Prepare and Scale the Data
scaler = StandardScaler()
X_scaled = scaler.fit_transform(X)
Scaling is essential here, since K means clustering relies entirely on distance calculations, and without scaling, a feature like annual income, measured in the tens of thousands, would completely dominate a feature like age, measured in single or double digits.
Select the Number of Clusters
wcss = []
for k in range(1, 8):
km = KMeans(n_clusters=k, init="k-means++", n_init=10, random_state=42)
km.fit(X_scaled)
wcss.append(km.inertia_)
plt.plot(range(1, 8), wcss, marker="o")
plt.xlabel("Number of Clusters (K)")
plt.ylabel("WCSS")
plt.title("Elbow Method for Optimal K")
plt.show()
Expected Output: